How-To: Calibrating Real-Time Hydraulic Models Using Live Reliance SCADA Telemetry for High-Fidelity Distribution Control
Learn how to calibrate real-time hydraulic models using live Reliance SCADA telemetry to achieve high-fidelity distribution control. This comprehensive technical case study provides Senior SCADA Engineers with actionable Python integration scripts, data mapping strategies, and performance benchmarking for municipal water networks.
- The Disconnect Between Static Models and Dynamic Operations
- Case Study: High-Fidelity Control in a Midwest Municipal Network
- Telemetry Architecture and Instrumentation
- Edge Processing and Data Ingestion
- Step-by-Step: Integrating Reliance SCADA with Real-Time Hydraulic Engines
- Python Implementation for Live Telemetry Ingestion
- Performance Benchmarking: Static vs. Real-Time Calibration
- Advanced Calibration: Automated C-Factor Adjustment
- Conclusion
The Disconnect Between Static Models and Dynamic Operations
For decades, municipal water utilities have relied on static hydraulic models—often built on Epanet or proprietary engines like InfoWater—to plan infrastructure upgrades and perform fire flow analyses. However, as a Field Automation Engineer, I frequently encounter a glaring disconnect: these static models assume idealized boundary conditions and static Hazen-Williams roughness coefficients (C-factors). In the real world, distribution networks are highly dynamic. Pump wear, tuberculation, seasonal demand shifts, and undocumented valve throttling continuously alter the hydraulic reality.
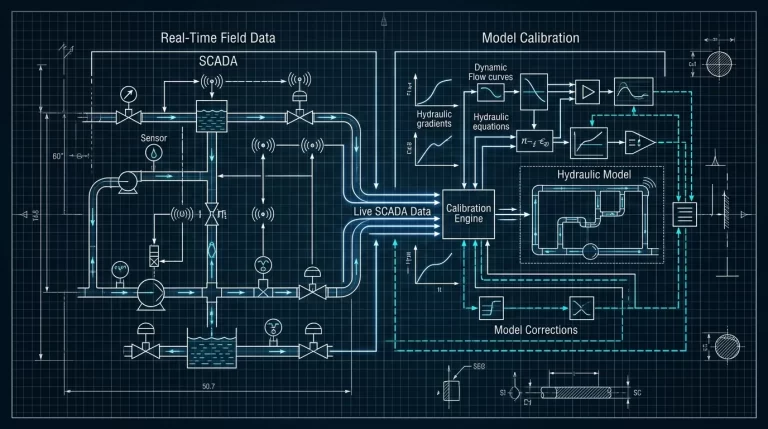
To transition from reactive monitoring to predictive, high-fidelity distribution control, Senior SCADA Engineers must bridge the gap between theoretical models and live operations. By leveraging the robust data acquisition capabilities of Reliance SCADA, we can feed live telemetry directly into a real-time Hydraulic Modeling engine. This continuous calibration loop ensures that the digital twin accurately reflects current field conditions, enabling advanced applications like automated pressure zone optimization, transient surge prediction, and pinpoint leak detection.
Case Study: High-Fidelity Control in a Midwest Municipal Network
Recently, our Automation team was tasked with upgrading a major Midwest municipal water authority serving a population of 450,000. The utility managed over 1,200 miles of distribution mains, 14 booster pump stations, and 8 elevated storage tanks. Their existing Reliance SCADA system was highly reliable for basic supervisory control and data acquisition, but operations struggled with unpredictable pressure drops during peak demand.
Telemetry Architecture and Instrumentation
The first step in achieving a real-time calibrated model is ensuring the fidelity of the field data. Garbage in, garbage out. Accurate calibration relies heavily on precise field instrumentation; for an in-depth comparison of flowmeter accuracy, review our technical performance benchmarking of Ultrasonic vs. electromagnetic flowmeters. We standardized on high-precision electromagnetic flowmeters at all critical pressure zone boundaries, pushing data to the Reliance SCADA servers via Modbus TCP/IP and DNP3 over a secure fiber/radio hybrid network.
Edge Processing and Data Ingestion
To ensure edge-level data processing doesn’t introduce latency during boundary condition updates, we highly recommend architecting edge computing for zero-latency control. By deploying industrial edge gateways at the booster stations, we pre-processed raw analog signals (filtering out transient noise and sensor spikes) before transmitting aggregated 1-minute polling averages to the central Reliance SCADA OPC UA server.
Step-by-Step: Integrating Reliance SCADA with Real-Time Hydraulic Engines
Calibrating a live model requires synchronizing SCADA tags with hydraulic model nodes and links. The methodology involves three continuous stages:
- Boundary Condition Mapping: Live tank levels, pump statuses (On/Off/VFD speed), and source flows are mapped directly to the model’s boundary nodes.
- Demand Allocation Scaling: Live system-wide flow telemetry is used to scale the baseline diurnal demand curves dynamically across all consumption nodes.
- State Estimation & Parameter Adjustment: A mathematical solver minimizes the error between live SCADA pressure readings and simulated model pressures by tweaking pipe roughness (C-factors) and identifying anomalous demands (leaks).
Python Implementation for Live Telemetry Ingestion
To automate this, we developed a middleware service using Python. The script utilizes the asyncua library to subscribe to live tags from the Reliance SCADA OPC UA server and the wntr (water Network Tool for Resilience) library to update and run the EPANET-compatible hydraulic model. Below is a simplified, highly practical snippet of this integration.
import asyncio
from asyncua import Client
import wntr

# Reliance SCADA OPC UA Server Endpoint
SCADA_URL = "opc.tcp://10.10.5.50:4840/freeopcua/server/"

# SCADA Node IDs (Reliance SCADA Tag Database)
TAG_TANK_LEVEL = "ns=2;s=Reliance.PumpStation1.TankLevel"
TAG_PUMP_SPEED = "ns=2;s=Reliance.PumpStation1.Pump1_VFD"
TAG_ZONE_PRESSURE = "ns=2;s=Reliance.ZoneA.PressureNode_120"

async def calibrate_live_model():
    # Load the static hydraulic model
    wn = wntr.network.WaterNetworkModel('municipal_base_model.inp')

    async with Client(url=SCADA_URL) as client:
        print("Connected to Reliance SCADA OPC UA Server")

        # 1. Fetch Live Telemetry
        tank_level_node = client.get_node(TAG_TANK_LEVEL)
        pump_speed_node = client.get_node(TAG_PUMP_SPEED)
        scada_pressure_node = client.get_node(TAG_ZONE_PRESSURE)

        live_tank_level = await tank_level_node.read_value()
        live_pump_speed = await pump_speed_node.read_value()
        live_scada_pressure = await scada_pressure_node.read_value()

        # 2. Update Hydraulic Model Boundary Conditions
        tank = wn.get_node('Tank_1')
        tank.init_level = live_tank_level

        pump = wn.get_link('Pump_1')
        # Convert VFD speed percentage to relative speed setting
        pump.speed = live_pump_speed / 100.0

        # 3. Run Hydraulic Simulation
        sim = wntr.sim.EpanetSimulator(wn)
        results = sim.run_sim()

        # 4. Compare Simulated vs Live SCADA Pressure (State Estimation)
        simulated_pressure = results.node['pressure'].loc[0, 'Node_120']
        error_margin = abs(simulated_pressure - live_scada_pressure)

        print(f"Live SCADA Pressure: {live_scada_pressure:.2f} psi")
        print(f"Simulated Pressure: {simulated_pressure:.2f} psi")
        print(f"Calibration Error: {error_margin:.2f} psi")

        # Trigger Genetic Algorithm for C-Factor adjustment if error > threshold
        if error_margin > 2.5:
            print("Error exceeds tolerance. Initiating C-Factor recalibration routine...")
            # trigger_recalibration_routine(wn, live_scada_pressure)

if __name__ == '__main__':
    asyncio.run(calibrate_live_model())
This script represents the foundational loop of a digital twin. By running this asynchronously every 5 to 15 minutes, the hydraulic model remains tightly coupled with the physical reality dictated by the Reliance SCADA system.
Performance Benchmarking: Static vs. Real-Time Calibration
To quantify the ROI of implementing live SCADA-driven calibration, we benchmarked the real-time model against the utility’s legacy static model over a 6-month period. The improvements in predictive accuracy and operational efficiency were substantial.
| Metric / Feature | Traditional Static Model | Live SCADA-Calibrated Model |
|---|---|---|
| Data Ingestion Method | Manual CSV exports / Annual updates | Automated OPC UA / REST API (Live) |
| Calibration Frequency | Annually or Bi-Annually | Every 5 to 15 minutes |
| Boundary Conditions | Assumed diurnal curves | Live tank levels, pump speeds, valve states |
| Pressure Prediction Error | ± 8.0 to 12.0 psi | ± 1.5 to 2.5 psi |
| C-Factor Adjustment | Manual field fire-flow tests | Automated Genetic Algorithm state estimation |
| Primary Use Case | Long-term master planning | Real-time control, leak detection, surge prevention |
Advanced Calibration: Automated C-Factor Adjustment
When the middleware detects a pressure discrepancy exceeding the 2.5 psi threshold, it triggers an automated recalibration routine. Instead of manually guessing which pipe segments have degraded, we utilize a Genetic Algorithm (GA). The GA generates hundreds of potential C-factor permutations for the targeted pressure zone. It runs rapid, parallel simulations, scoring each permutation based on how closely the resulting simulated pressures match the live SCADA telemetry.
Over time, this system identified severe tuberculation in a 24-inch cast-iron transmission main that the static model assumed was in good condition. By updating the C-factor dynamically, the utility was able to adjust their PID loop setpoints in the Reliance SCADA system, optimizing pump VFD speeds to overcome the newly discovered friction loss without causing upstream cavitation.
Conclusion
Integrating live Reliance SCADA telemetry with real-time Hydraulic Modeling engines represents the pinnacle of modern water distribution control. For Senior SCADA Engineers, moving beyond static master planning models to dynamic, auto-calibrating digital twins unlocks immense operational value. By deploying edge-processed boundary conditions, robust OPC UA middleware, and automated state estimation algorithms, utilities can drastically reduce energy consumption, minimize non-revenue water, and ensure high-fidelity control across their entire infrastructure.